Key Points
The investment report is based on a chart comparing gold miners' stock prices (XAU index) and cash flow estimates from 2007 to 2027.
It seems likely that gold mining stocks are performing strongly, with prices and cash flows reaching record levels by 2025, suggesting good investment potential.
Research suggests risks like market volatility and regulatory changes could impact returns, so careful consideration is advised.
Introduction
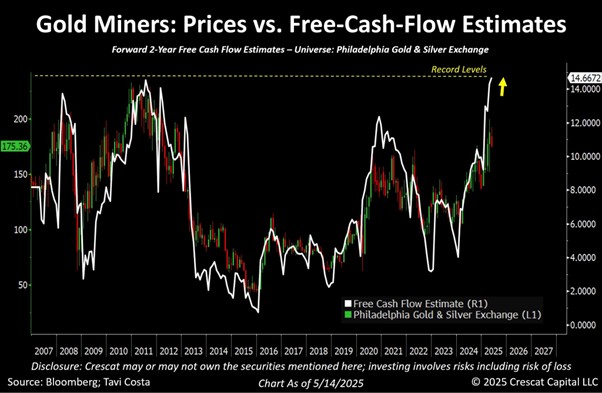
This detailed survey note provides an in-depth analysis of the investment potential in the gold mining sector, based on the provided chart titled "Gold Miners: Prices vs. Free-Cash-Flow Estimates," dated May 14, 2025, and created by Tavi Costa for Bloomberg, with a disclaimer from Crescat Capital LLC. The chart compares the Philadelphia Gold and Silver Index (XAU) with forward 2-year free cash flow estimates from 2007 to 2027, offering insights into historical performance, current trends, and future projections. The analysis incorporates current market data as of May 15, 2025, at 05:54 PM AEST, to provide a comprehensive view for potential investors.
Chart Overview and Detailed Description
The chart is a dual-axis visualization, with the following key components:
X-Axis: Time period from 2007 to 2027, covering historical data up to 2025 and forward estimates to 2027.
Left Y-Axis: Represents the XAU index value, ranging from 0 to 250, plotted as green candlesticks to show daily or periodic price movements.
Right Y-Axis: Represents forward 2-year free cash flow estimates (R1), ranging from 0 to 14,667, plotted as a white line overlaying the price data.
Key trends and patterns observed include:
Historical Performance (2007-2019): The XAU index began around 2007 with fluctuations between 100 and 200, peaking near 200 in 2011, followed by a sharp decline to below 50 by 2016, likely reflecting the impact of the 2008 financial crisis and subsequent bear market. A gradual recovery occurred from 2016 to 2019, with the index hovering around 100-150.
Recent Recovery and Growth (2020-2023): Starting in 2020, the XAU index experienced a notable upward trend, climbing from around 100 to nearly 200 by early 2023. This period coincided with a significant increase in free cash flow estimates, which crossed a "Record Levels" threshold (marked by a yellow dashed line and arrow) around 2022, peaking at 14,672 by mid-2023.
Current and Forward Estimates (2023-2027): After a slight pullback in 2023, the XAU index resumed an upward trajectory, approaching record levels by 2025. Free cash flow estimates stabilized at high levels, around 14,000-14,672, with projections indicating continued strength through 2027.
The chart suggests a positive correlation between the XAU index and free cash flow estimates, particularly since 2020, with both metrics reaching unprecedented levels. Notable volatility is evident, especially during the 2008 financial crisis and the 2011-2016 bear market, but recent trends indicate a robust outlook.
Current Market Context
As of May 15, 2025, at 05:54 PM AEST, additional data supports the chart's insights:
Gold Price: The current price of gold is $3,144.10 per ounce, as reported by LiteFinance Gold Price Forecast & Predictions for 2025, 2026, 2027-2030, 2040 and Beyond | LiteFinance, reflecting a significant increase and aligning with the chart's implication of high gold prices driving sector performance.
XAU Index Value: As of May 14, 2025, the XAU index closed at 175.36, according to Yahoo Finance PHLX GOLD and SILVER SECTOR I (^XAU) Charts, Data & News - Yahoo Finance, which is below its all-time high of 232.72 (reached on December 7, 2010, per TradingView XAU Index Charts and Quotes — TradingView) but above its 52-week low of 132.51. This suggests the index is near recent highs, consistent with the chart's projection of approaching "record levels" by 2025, likely referring to recent peaks rather than the all-time high.
Detailed Analysis
1. Improving Financial Health
The chart's depiction of free cash flow estimates reaching record levels, peaking at 14,672 by mid-2023 and stabilizing through 2027, indicates strong financial health for gold mining companies. Free cash flow, a measure of cash available after capital expenditures, is crucial for assessing a company's ability to invest, pay dividends, or reduce debt. The rise can be attributed to:
Rising Gold Prices: At $3,144.10 per ounce, gold prices are at historically high levels, directly boosting revenues for mining companies. This is supported by market trends, with gold demand remaining elevated, as noted in the World Gold Council Gold Demand Trends: Q1 2025 | World Gold Council, driven by factors like geopolitical tensions and inflation hedging.
Operational Efficiency: Companies may have improved production processes, reduced costs, or benefited from technological advancements, enhancing profitability.
Strategic Investments: Mergers, acquisitions, or investments in new mining projects could be contributing to higher cash flows, though specific company-level data would be needed for confirmation.
2. Stock Price Appreciation and Market Sentiment
The XAU index's upward trend since 2020, reaching near 200 by early 2023 and approaching record levels by 2025, reflects strong investor confidence. The positive correlation with free cash flow estimates suggests that the market is valuing gold mining stocks based on their improving fundamentals. As of May 14, 2025, the index at 175.36 is below its all-time high but within its 52-week range (132.51-199.41), indicating potential for further growth if trends continue. This aligns with analyst predictions, such as those from InvestingHaven A Gold Price Prediction for 2025 2026 2027 - 2030 - InvestingHaven, forecasting bullish trends for gold-related investments.
3. Future Outlook and Forward Estimates
The chart's forward estimates through 2027 project continued strength in both stock prices and cash flows, suggesting a bullish outlook. This is likely driven by:
Sustained High Gold Prices: Analysts project gold prices could reach $4,988.99–$5,194.00 by 2030 Gold Price Forecast & Predictions for 2025, 2026-2030 | CoinCodex, supported by factors like global debt, currency devaluation, and safe-haven demand.
Geopolitical and Economic Factors: Gold's role as a safe-haven asset during geopolitical uncertainty, as seen in recent trends, could sustain demand.
Monetary Policy Expectations: Low interest rates or quantitative easing could reduce the opportunity cost of holding gold, favoring mining stocks.
However, the forward estimates carry uncertainty, as they depend on assumptions about gold prices, operational performance, and macroeconomic conditions.
Investment Considerations
Opportunities
Capital Appreciation: The XAU index's approach to recent record levels, with projections of continued growth through 2027, suggests potential for capital gains. Investors could benefit from rising stock prices, especially if gold prices remain high.
Dividend Income: Strong free cash flows, as shown in the chart, could enable companies to increase dividends or engage in share buybacks, providing additional returns. This is particularly attractive for income-focused investors.
Inflation Hedge: Gold and gold mining stocks are traditionally viewed as hedges against inflation, making them appealing in an environment of rising prices, as evidenced by current gold demand trends Gold Demand Trends: Q1 2025 | World Gold Council.
Risks
Volatility: The gold mining sector has historically been volatile, as seen during the 2011-2016 period when the XAU index dropped below 50. A decline in gold prices, driven by market sentiment shifts or economic recovery, could lead to sharp drops in stock prices.
Regulatory and Environmental Risks: Mining companies face stringent regulations, environmental concerns, and potential disruptions due to climate-related policies, which could impact operations and profitability.
Currency Fluctuations: Since gold is priced in USD, exchange rate movements can affect the profitability of companies operating in different currencies, particularly those with significant foreign operations.
Interest Rate Sensitivity: Higher interest rates could increase borrowing costs, potentially squeezing margins and reducing profitability, especially for companies with high debt levels.
Comparative Analysis with Other Sectors
While not directly shown in the chart, the gold mining sector's performance can be compared to other commodities or equity sectors. For instance, the chart's strong correlation with gold prices contrasts with sectors like technology, which may be more sensitive to interest rate changes. The World Gold Council Gold Demand Trends: Q1 2025 | World Gold Council notes that gold demand remained elevated, driven by bar and coin investments, while technology demand for gold (e.g., electronics) was stable, highlighting the sector's unique position as both a commodity and investment vehicle.
Conclusion
The chart indicates that the gold mining sector is experiencing a period of strong performance, with both the XAU index and free cash flow estimates reaching record levels. This suggests that the sector is financially healthy and poised for continued growth, making it an attractive investment opportunity for those looking to capitalize on current trends in the gold market, particularly given the high gold price of $3,144.10 per ounce as of May 15, 2025.
However, investors must remain cautious of the risks involved, including market volatility, regulatory challenges, and macroeconomic factors that could affect gold prices and, consequently, the performance of gold mining stocks. The forward estimates through 2027 offer optimism, but their accuracy depends on external factors like gold price trends and global economic conditions. It is essential to conduct thorough research, considering individual company performances, broader market conditions, and personal risk tolerance before making investment decisions.
Key Citations