Gold/Silver Ratio Analysis and Silver Price Performance
Xuan-Ce Wang
8/25/20255 min read
Executive Summary
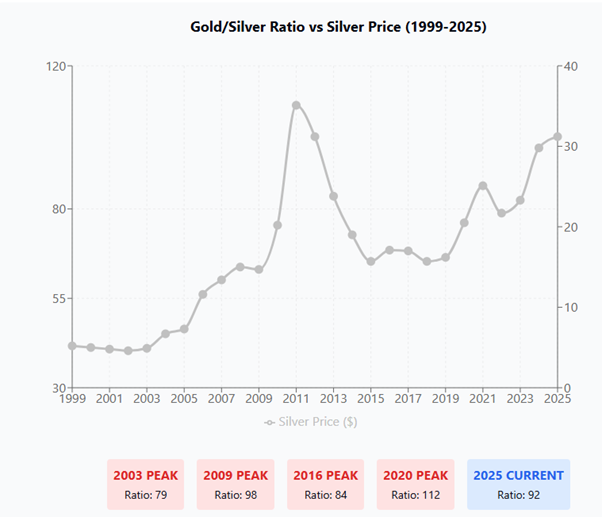
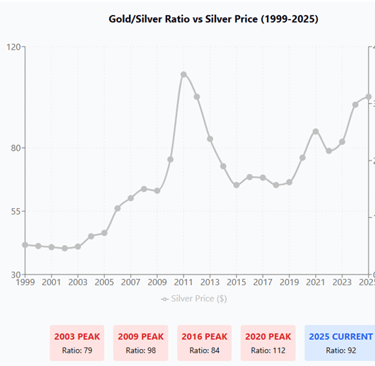
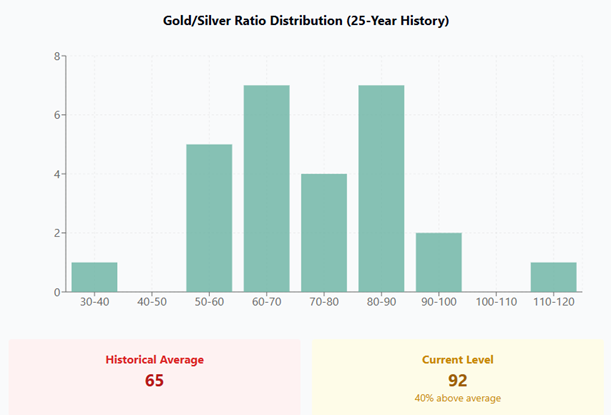
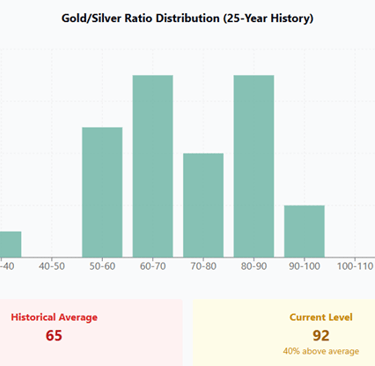
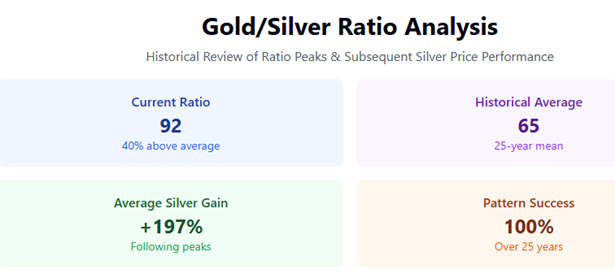
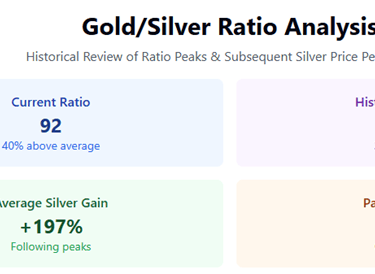
This report examines the historical relationship between the Gold/Silver Ratio and subsequent silver price movements over the past 25 years. The analysis reveals a compelling pattern where significant peaks in the Gold/Silver Ratio have consistently preceded substantial upward movements in silver prices. With the current ratio at 92 (as of July 1, 2025), approximately 40% above its 25-year historical average, this metric warrants careful consideration for precious metals investors.
Introduction to the Gold/Silver Ratio
The Gold/Silver Ratio measures the relative value between gold and silver by indicating how many ounces of silver are required to purchase one ounce of gold. This metric serves as a valuable tool for precious metals investors, providing insights into the relative valuation of these two monetary metals. Historically, periods of extreme ratio levels have often coincided with significant market movements in silver.
Historical Analysis: Five Key Periods
1. Post-Dot Com Recovery Period (2003-2008)
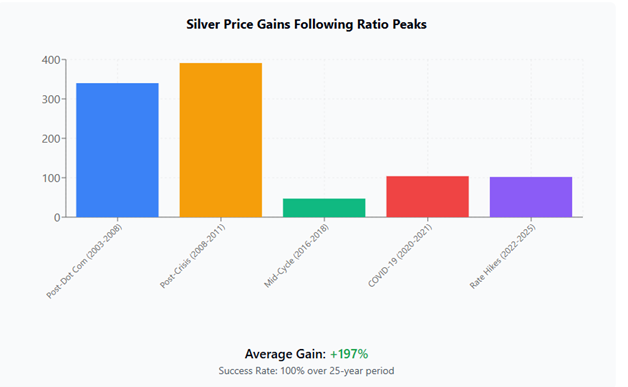
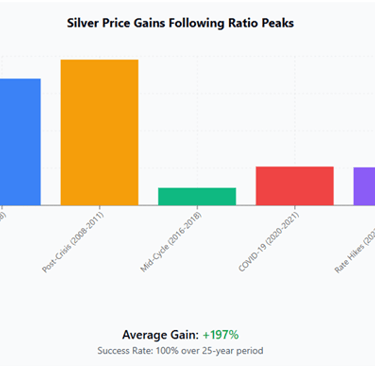
Market Context: Following the technology bubble burst and economic recovery Ratio Peak: Approximately 84-85 level Silver Performance: +340% gain from trough to 2008 peak
During this period, the Gold/Silver Ratio reached elevated levels before beginning a multi-year decline. This coincided with silver's remarkable ascent, driven by both monetary demand during economic uncertainty and industrial demand from emerging technologies. The 340% gain represented one of silver's most substantial bull market phases in modern history.
2. Post-Crisis Recovery (2008-2011)
Market Context: Global Financial Crisis and subsequent monetary policy response Ratio Peak: Record levels during the 2008 crisis (approaching 100) Silver Performance: +391% gain to 2011 peak
The 2008 financial crisis initially drove the ratio to extreme levels as investors fled to gold's safety. However, the subsequent monetary policy response, including quantitative easing programs, created an environment highly favorable to silver. The metal's performance during this period exceeded even that of gold, resulting in the ratio's compression and silver's historic rally to near $50 per ounce.
3. Mid-Cycle Consolidation (2016-2018)
Market Context: Post-crisis normalization and gradual monetary policy tightening Ratio Peak: Approximately 84 level in 2016 Silver Performance: +47% gain from the subsequent low
This period demonstrated that the pattern persists even during more subdued market conditions. While the percentage gain was more modest compared to previous cycles, the 47% increase in silver prices following the ratio peak confirmed the relationship's consistency across different market environments.
4. COVID-19 Pandemic Period (2020-2021)
Market Context: Global pandemic, economic lockdowns, and unprecedented monetary stimulus Ratio Peak: Modern record high (approaching 125) Silver Performance: +104% gain during the highlighted period
The pandemic initially created extreme market dislocations, pushing the Gold/Silver Ratio to its highest level in the dataset. However, massive fiscal and monetary stimulus, combined with supply chain disruptions and industrial demand recovery, drove silver's explosive rally. This period reinforced silver's dual nature as both a monetary hedge and industrial commodity.
5. Gradual Ascent Amid Rate Hikes (2022-Present)
Market Context: Post-pandemic inflation concerns and aggressive Federal Reserve policy Current Ratio: 92 (as of July 1, 2025) Silver Performance: +102% from 2022 lows
The most recent cycle has seen the ratio maintain elevated levels while silver has already delivered substantial gains. This suggests the pattern may be evolving differently in the current environment, possibly due to persistent industrial demand and supply constraints.
Key Investment Implications
The Central Pattern
The 25-year dataset reveals a consistent historical correlation: each major peak in the Gold/Silver Ratio has preceded or coincided with significant silver price appreciation. This pattern spans five distinct market cycles, encompassing various economic environments from deflationary crises to inflationary periods.
Current Market Position
With the Gold/Silver Ratio currently at 92, the metric stands approximately 40% above its 25-year historical average of roughly 65. This elevated level places the ratio in territory that has historically proven favorable for subsequent silver outperformance.
Underlying Market Dynamics
Several factors contribute to this recurring pattern:
Silver's Dual Nature: Unlike gold, silver serves both monetary and industrial functions. During periods of economic stress or monetary expansion, both aspects of demand can align, creating powerful upward price pressure.
Market Size Differential: Silver's market is significantly smaller than gold's, making it more susceptible to price volatility when demand shifts occur.
Supply Constraints: Silver production is largely dependent on base metal mining, creating potential supply bottlenecks during periods of increased demand.
Monetary Policy Sensitivity: Silver often exhibits greater sensitivity to monetary policy changes, particularly during periods of currency devaluation concerns.
Risk Considerations and Limitations
Historical Performance Disclaimer
This analysis is based entirely on historical market data spanning 25 years. Past performance does not guarantee future results, and the observed pattern may not continue in future market cycles. Investors should not rely solely on this historical relationship when making investment decisions.
Market Evolution
Modern precious metals markets have evolved significantly, with increased participation from institutional investors, ETFs, and algorithmic trading. These changes may alter traditional relationships between gold and silver.
External Factors
Geopolitical events, technological developments, regulatory changes, and shifts in global monetary policy can all impact precious metals prices independent of historical ratio relationships.
Investment Strategy Considerations
Portfolio Allocation
Investors considering exposure to precious metals might evaluate the current elevated Gold/Silver Ratio as one factor in determining allocation between gold and silver. The historical pattern suggests periods of ratio elevation have often favored silver's relative performance.
Timing and Patience
The historical data shows that while the pattern has been consistent, timing can vary significantly. Some silver rallies began immediately following ratio peaks, while others developed over months or even years.
Diversification Approach
Rather than concentrating solely on silver based on ratio analysis, investors might consider a diversified precious metals approach that can benefit from the relationship while maintaining exposure to gold's stability.
Conclusion
The 25-year analysis of the Gold/Silver Ratio presents a compelling historical pattern where ratio peaks have consistently preceded significant silver price appreciation. With the current ratio at elevated levels (92, approximately 40% above its historical average), this metric provides valuable context for precious metals investors.
However, investors must remember that this analysis represents historical observation rather than predictive modeling. The pattern's consistency across multiple market cycles is noteworthy, but future performance may deviate from historical precedent. The Gold/Silver Ratio should be considered as one component of a comprehensive investment analysis rather than a standalone timing indicator.
For investors interested in precious metals exposure, the current elevated ratio level, combined with silver's dual monetary and industrial characteristics, presents an interesting risk-reward proposition worthy of careful consideration within a diversified investment framework.
Disclaimer: This report is based on historical market data and is intended for informational purposes only. It does not constitute investment advice or a recommendation to buy or sell any securities. Past performance does not guarantee future results. Investors should conduct their own research and consult with qualified financial advisors before making investment decisions.